News and Insights
Research-driven thought leadership to earn attention. Why and how with 5 tips.
August 18, 2021
Tale as old as “modern” time
The notion of using research-driven thought leadership for a variety of brand, marketing and business development goals is not new. Some say the consulting firm McKinsey was the ground breaker in doing so as early as the 1960s, when they first published The McKinsey Quarterly. It was 1964 to be exact. The reported strategic reason for the publication, which often featured primary research, was that the crowded field of management consulting was becoming commoditized. This might explain the high-end packaging of the Quarterly on top of its insightful subject matter. Fast forward to 2021 and firms of all shapes and sizes are engaged in a thought leadership and content marketing arms race — most in the form of eblasts, webinars, alerts, white papers, videos, blog posts, podcasts, and such. Outside of the largest firms, few are using primary market research to shape a view and share a perspective on client and market challenges. This is an opportunity for many firms, regardless of size.
If you are not McKinsey or a Big Four, can you do this?
You bet you can. Yes, it can be relatively expensive to do primary research and turn it into interesting (and well designed) thought leadership, yet the next tier of accounting, law, engineering, architecture, and consulting firms are stepping up, as are many other B2B marketers. The accounting, tax, and advisory firm, Citrin Cooperman, is a case study in point. The firm does its research-driven thought leadership not to replace alerts, blogs, and such. They do it to fuel these content, campaign and PR programs and stand out from the crowded field of content marketers.
Citrin Cooperman’s Research in a Nutshell
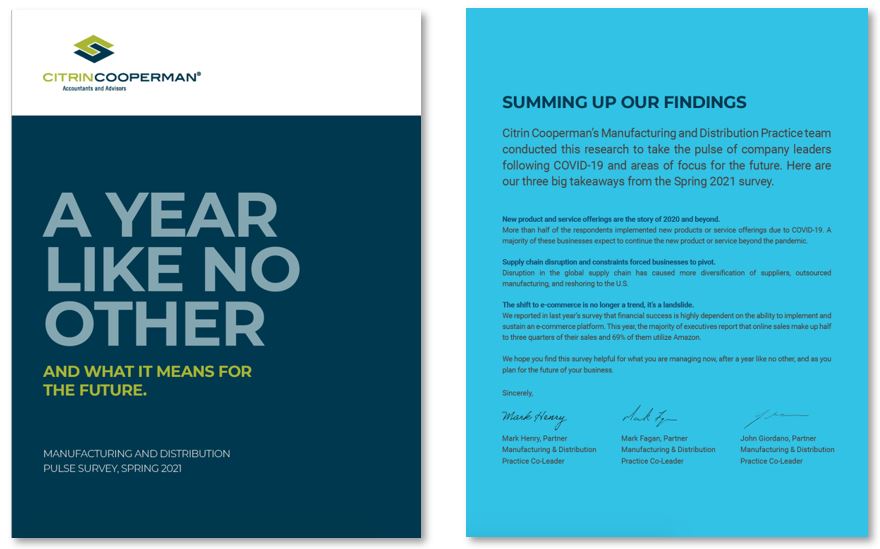
Citrin Cooperman’s Manufacturing and Distribution Practice launched the findings report for its 2nd annual industry survey in mid-June of this year. The aim of this research is to take the pulse of manufacturing and distribution company leaders — following COVID-19 — to measure the health of their businesses and take stock of future priorities, concerns, and challenges. This year’s survey explores the impact of the pandemic on the industry and how businesses pivoted to survive, including managing new product offerings, technology implementation, and supply chain disruptions.
This survey was conducted online in conjunction with the research arm of FINN Partners between March 30 and April 14, 2021. Respondents had to be VP/SVP of operations or above and work within companies generating $10M annual review or more. A total of 200 respondents took the survey.
In a collaborative effort, the Citrin Cooperman practice leaders, marketing leaders and FINN researchers shaped the questionnaire over a six-week period before putting it in the field in March. We all also partnered to synthesize and interpret the findings, write, and design the report, and brainstorm ways to promote it.
Five tips for sharing and packaging your findings.
- Make it super easy for people to grasp what’s in the report and why the audience should care. We can not overstate the importance of a good headline and crisp executive summary. It is your opening salvo. A 24-page report is a lot for anyone to get through. Tell audiences what they are going to find inside. As Citrin does with the line: “A year like no other… and what it means for the future.” See for yourself in the art below.
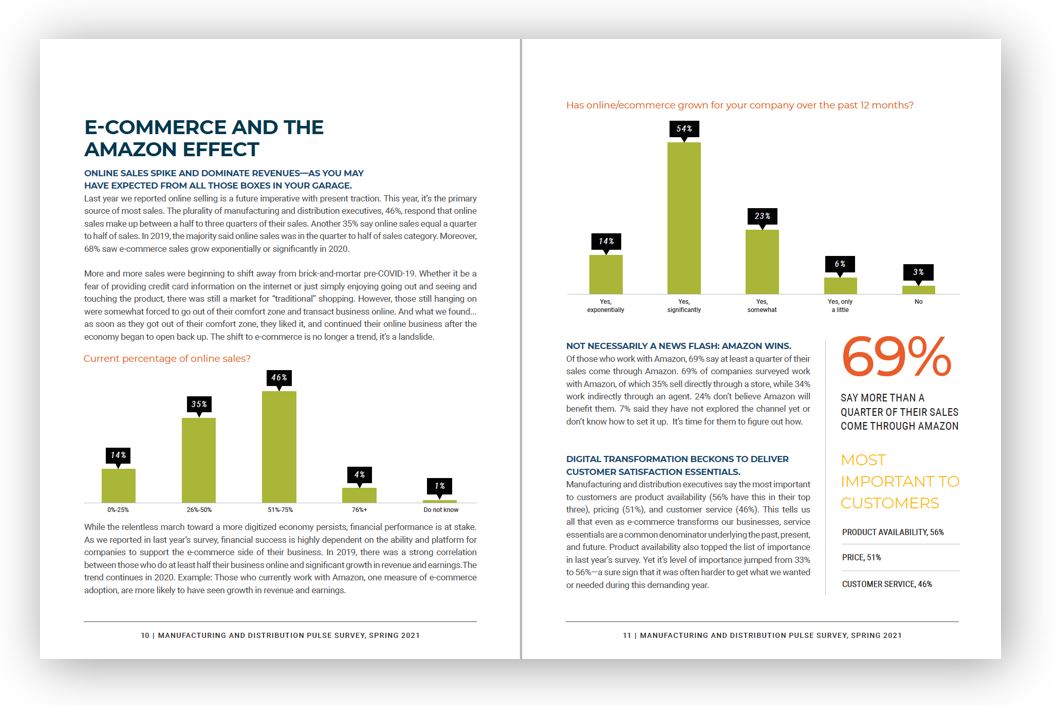
- Organize findings in easy to comprehend chapters. In Citrin’s case, dozens of questions and lots of data became eight overarching thematic sections on topics like Financial Performance, E-Commerce and The Amazon Effect, Data Analytics and Exit Plans. In this report, the big themes each become a spread. If the reader has no interest, they can move to the next chapter or one that is of deeper interest with ease. The approach is courteous to the perusing reader. A chapter is shared just below as an example.
- Remember we don’t have readers these days, we are all scanners—at least at work. Eye-tracking studies for all forms of communication suggest our eyes go to shapes, colors, large headlines, images, big call outs and sub-headlines. And last, to paragraphs of text. Putting these in balance is a challenge you need to rise to in your writing and design. See above.
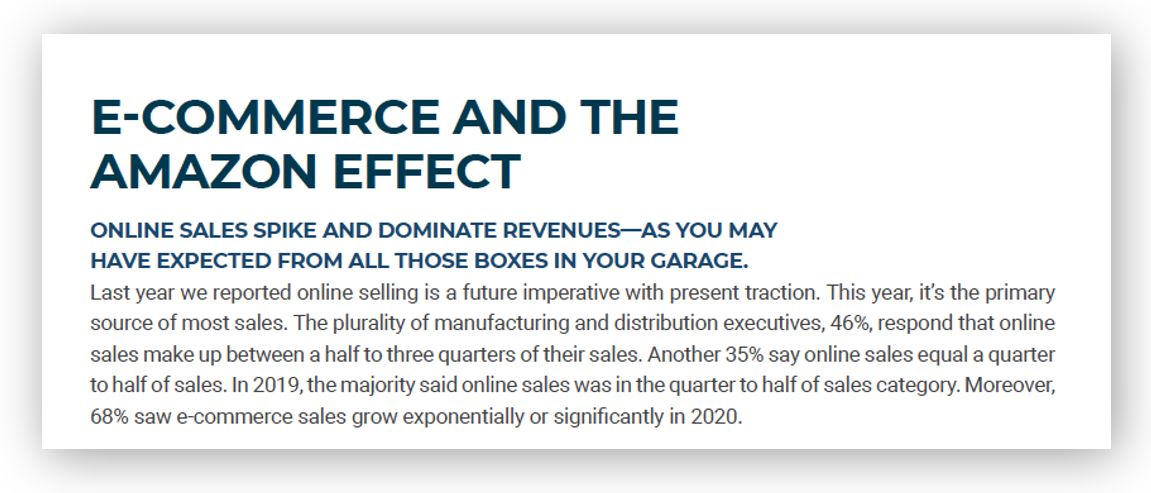
- In writing, appeal to the reader, their common sense and what they know from every day experience. A report might be a logical document, but that does not mean the writing needs to be all business. You can work your wit into the most serious topics, like the Amazon effect sub headline: “Online sales spike and dominate revenues — as you might expect from all those boxes in your garage.” Check it out in context below. Speaking of writing, make sure to share expert opinions and insights, not just the data and the facts. Subject matter experts are labeled as such for a reason. Be sure to give strong voice to your observations about the findings, not just the findings themselves.
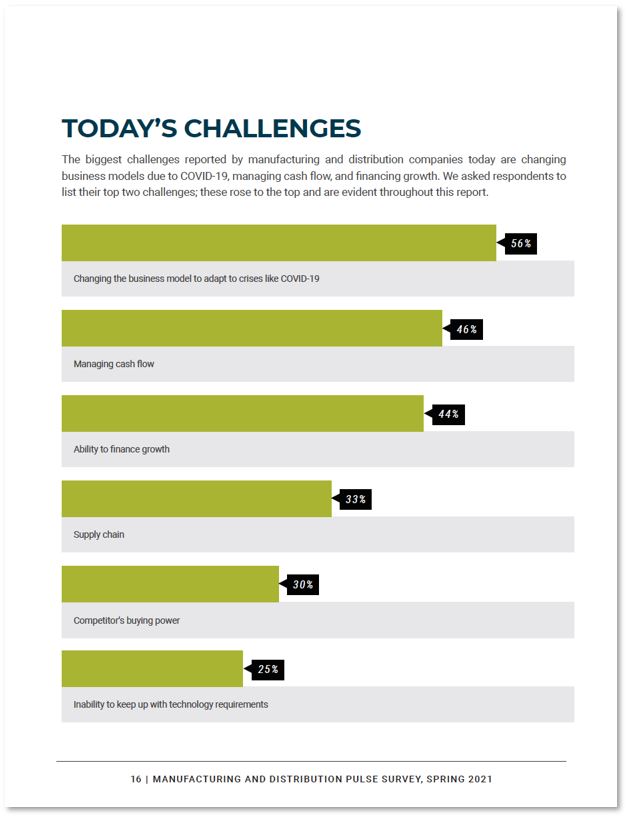
- Make your charts and graphs simple and easy to read. Always remember and cater to your audience. In this instance the demographic is probably a 40+ something executive, more likely 50+. Don’t make them squint or worse as they work their way through your material. A good example of designing for your audience is shared below with a full-page chart. Also remember, pages are free in PDF “books.” Air out your content wherever possible.
Interested in doing research-driven thought leadership on your own? Here are a couple of parting thoughts for a successful project:
- Make sure your lead practice group or industry partners/executives, your subject matter experts, are in the game. The project is more likely to gain steam and get funded with their interest and endorsement.
- Keep them on track with solid project management and the support of the marketing team from thought to finish—they can’t do it without you.
- Invest in an outside partner who can help you shape and execute solid research, as well as help you write and design your report in a way that relates to your audience, carries your brand and impresses.
- Consider engaging a third party, like an economist (as Citrin Cooperman did in a foreword to the report) to help you make macro sense of your findings.
- Have your content marketers and PR teams briefed and ready to make the most of the findings. The notion is simple: leverage the findings for all they are worth in your communications—from the big picture story to the many story lines the data reveals.