News and Insights
2019 U.S. Holiday Shopping Survey
December 5, 2019
Introduction
In November 2015, FINN Partners asked consumers about their shopping preferences and opinions and among several things there was high resistance to shopping on Thanksgiving Day, little or no attention paid to holiday shopping advertising, and technology products were the most popular types of gifts to give. Four years later we see consistencies with some shifts in attitudes. The big three holiday shopping days are again avoided by shoppers in 2019, but there are more shoppers paying attention to holiday shopping advertising over the Thanksgiving weekend. Technology and electronics gifts are the third most planned shopping choices in 2019 as gift cards or cash and clothing/apparel are favored.
This year we asked some new questions of holiday shoppers including if they plan to give gifts at all, what types of gifts they’d like to receive, and how they plan to pay for holiday gifts. What were the big take-aways?
- Are we at the Venmo-zation of holiday shopping? Consumers are taking less chances with purchases, opting for gift cards or cash rather than tech and electronics items. Shoppers also want that flexibility for themselves hoping to receive gift cards or cash over other types of gifts. With transaction charges as high as 3% on some personal e-payment services when using a credit card is it a matter of time before gifting becomes almost completely frictionless?
- Big shopping days aren’t big in shoppers’ minds but deals are. In both 2015 and this year in 2019, shoppers are choosing to avoid the big shopping days of Black Friday, Small Business Saturday and Cyber Monday. Nearly half of shoppers said they’d avoid them completely but a significant portion are paying attention to holiday shopping ads, looking for deals whether or not they’re occuring on those big shopping days.
- Plastic dominates holiday shopping transactions. Debit and credit cards are preferred by more than 66% of holiday shoppers. Despite offerings of low or no interest extended payment plans shoppers still prefer interest-accruing credit cards nearly 10-times more than they do payment plans.
Holiday Shopping Strategies
Most plan to give, but it’s not unanimous
More than 62% of Americans plan to give gifts to friends and loved ones this holiday season while 38% don’t plan to give gifts — those responses were fairly uniform across genders and age groups.

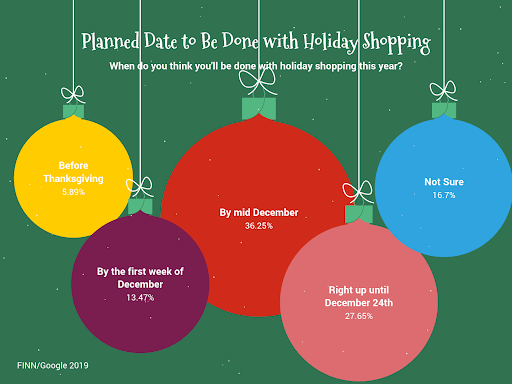
Shoppers aim for mid-December to finish shopping and fewer think they’ll be done before or after that.
22% of 2015 shoppers said they’d be done with gifts in early December but those aspirations seem to have faded slightly this year with only 13.5% indicating so. Similarly, 27% of shoppers said they’d be shopping right up until December 24th which dipped slightly from 32% in 2015. Millennials and Gen X shoppers are more likely expecting to be done with gifts between mid-December and the 24th.
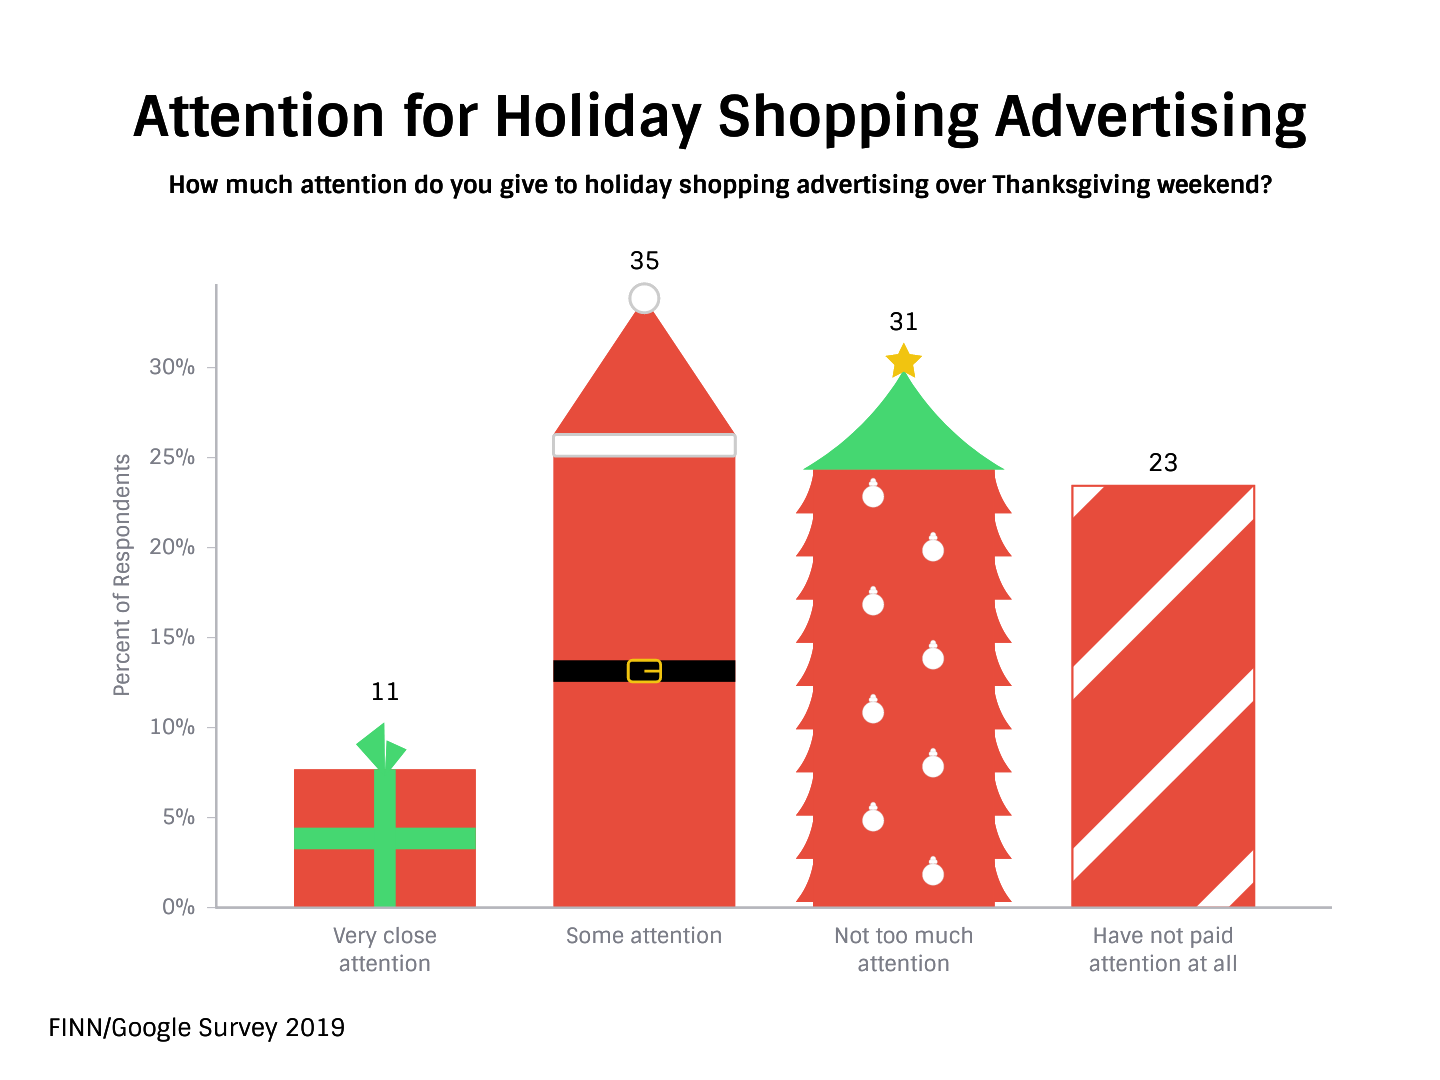
Shoppers show a stronger interest in holiday shopping advertising but most will avoid the big three shopping days if they can.
More than 40% of 2019 shoppers said they paid some or very close attention to holiday shopping advertising, compared to only 24% in 2015. At the same time, those paying little or no attention at all to holiday shopping advertising dropped from more than 75% in 2015 to 54% this year.
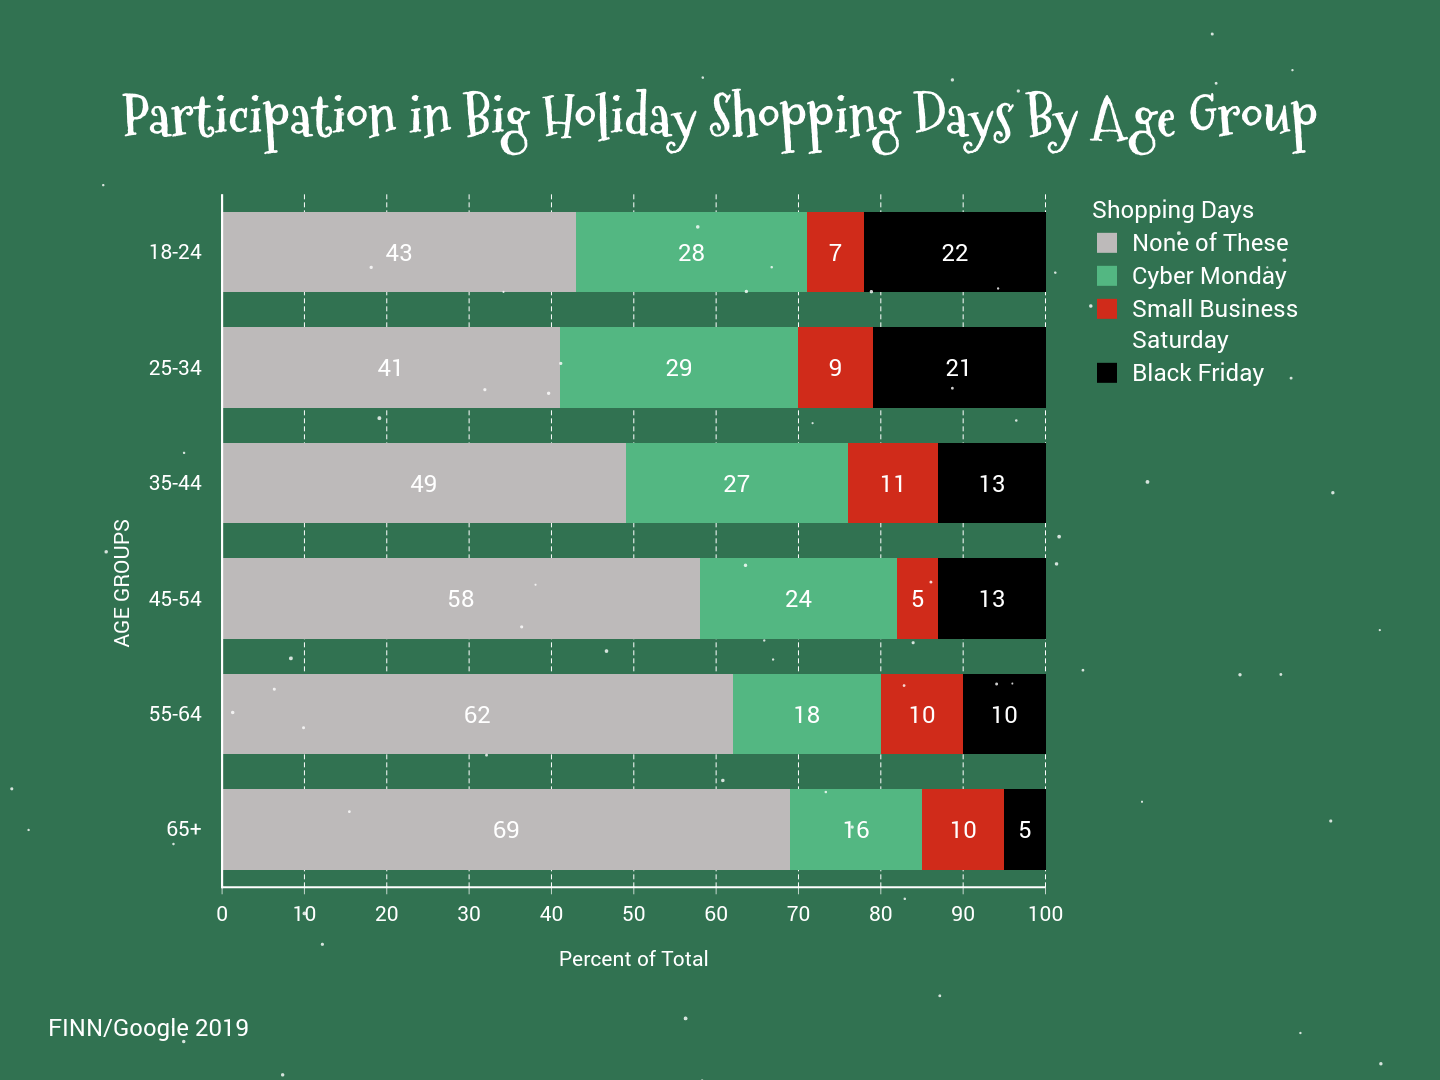
Unfortunately, this hasn’t translated to hitting the stores over the weekend with more than half of shoppers (55%) saying they’d avoid all of the big three shopping days this holiday season. We can see some positive shifts in popularity amongst those that would participate in the big shopping days, compared to 2015.

In 2015 shoppers were split evenly on their intention to shop on Cyber Monday but it was the most favored big shopping day in 2019, compared to Black Friday and Small Business Saturday. Age mattered here, where the younger the shopper, the more likely they’d be shopping on the big three days and the older the shopper, the less likely they’d participate in any of them.
When shoppers do go brick and mortar, they’re still purchasing online
In years past we’ve asked which formats holiday shoppers prefer including online and retail, and more than twice as many preferred online vs. the next closest retail option – big-box retailers. This year we looked only at retail preferences and can see that showrooming – the practice of looking in a retailer location then purchasing online – confirms online shopping’s dominance. Despite Small Business Saturday being the least popular “shopping day”, local small business shopping was the next most popular format overall – up from 2015 – while big-box retailers and shopping malls are both lower than 2015.

Most Popular Types of Gifts
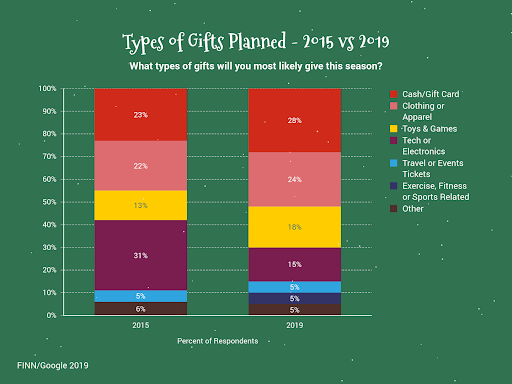
Gift cards and clothing top lists of most shoppers while tech and electronics gifts are less popular than they were in 2015.
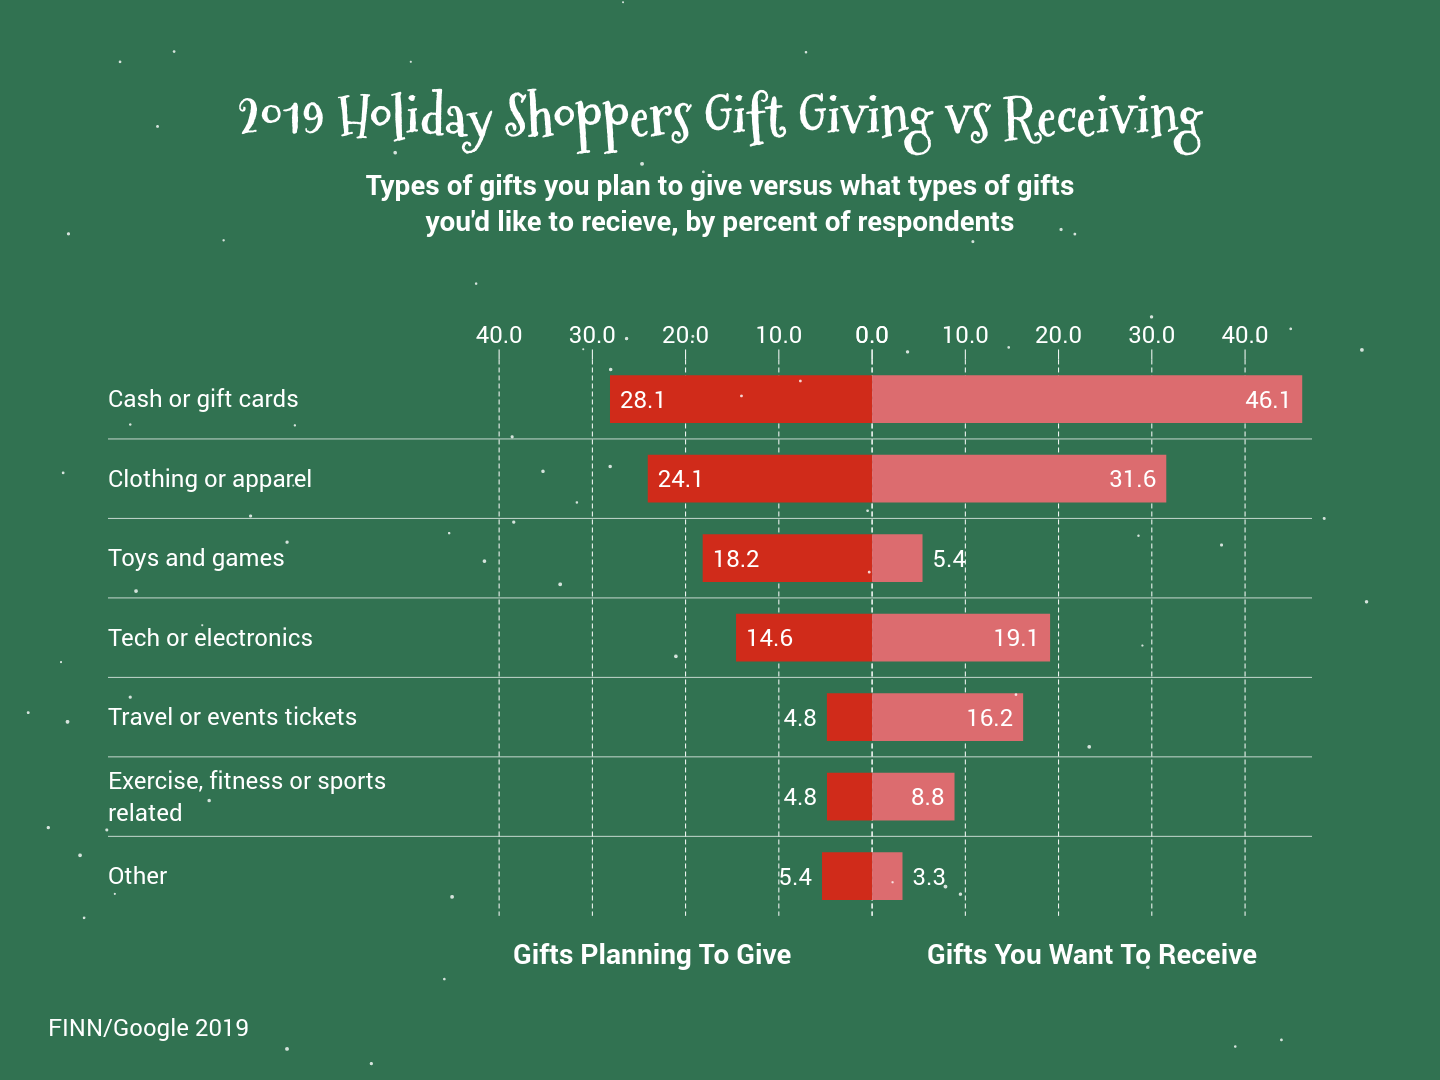
In 2015 when we asked shoppers what types of gifts they plan on giving, it was technology and electronics leading the pack at 31% but less than half as many shoppers indicate so (15%) in 2019. Cash or Gift Cards, Clothing or Apparel, and Toys & Games were more popular among 2019 shoppers, up 2-5% from 2015.
For the first time we asked shoppers what types of gifts they wanted to receive in addition to what they planned to give. For the most part, their preferences to receive were aligned with what types of gifts they planned to give. The exceptions being that shoppers were far less likely to want to receive toys — which is no surprise given their ages — then they planned to give. Shoppers also wanted to receive tickets for travel/events and sports or exercise equipment more than they’d plan to give those types of gifts. More than 46% of shoppers wanted to receive gift cards or cash.
Money and Holiday Shopping
Most shoppers say they’ll spend the same amount they did last year but some expect to spend less than 2015.
Nearly 60% of shoppers expect they’ll spend the same amount they did last year, but compared to 2015 they seem less willing to spend more and more expect to spend less. 27.4% of shoppers expect to spend less this year, which is a 10.7% increase from 2015. And only 13% of shoppers expect to spend more this year, which is down 27% from 2015 at 40%. Gender and age of shoppers had no significant impact on their responses.
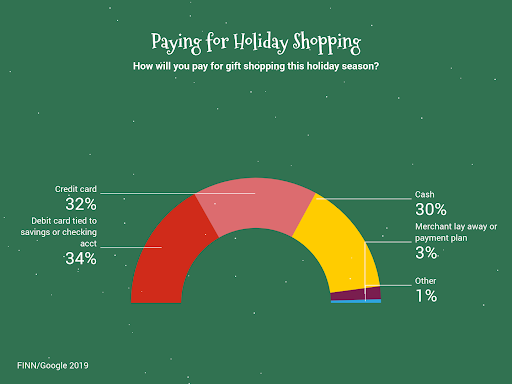
While most shoppers said they’d rely on debit cards over credit cards, those of Boomer age preferred using credit cards far more than other forms of payment, followed by cash before using debit cards. Despite the availability of low or no interest lay-away or payment plans from merchants very few shoppers (3.3%) anticipated using that purchase funding source.
Methodology
FINN Partners developed the survey questions in November 2019. A portion of the questions in the 2019 survey were questions asked in a similar survey at the same time of the year in 2015. FINN utilized Google Consumer Surveys in 2015 and 2019. The 2019 survey was fielded to 1,000 U.S. consumers between November 27th-29th, 2019.
About Google Surveys
Google Surveys offers two panels of respondents: (1) internet users reading content on a network of web publisher sites using Google Opinion Rewards for Publishers, and (2) smartphone users who have downloaded and signed up to use an app called Google Opinion Rewards. The publisher network uses inferred demographics, while the mobile app asks users to self-report their age, gender and zip code.
Google evaluates the representativeness of a survey by balancing its sample demographics to match the demographics of the target population: adult (18 or older) internet users. They match based on three demographic dimensions: age, gender, and geography. In the US, they use estimates for the national internet population from the US Census Bureau’s 2017 Current Population Survey (CPS) Computer and Internet Use Supplement. In other countries, they rely on a combination of government data and internal Google data sources.
Google Surveys uses a two-step process to ensure each survey’s representativeness. First, they use stratified sampling to dynamically target respondents with the goal of matching the demographics of the target internet population. Next, they apply post-stratification weighting to more closely match those same demographics of the target internet population.
You can find a full description of the Google Surveys methodology in this whitepaper or in the product overview